
Looking at the chart
The bar floating at the foot of the chart changes how the chart is shown. It is there in every workspace, whatever tool you hold, and fades while you draw so you can see beneath it. None of it changes the chart itself.

Colour, B&W and Stitched
| View | Key | What it shows |
|---|---|---|
| Colour | 1 | The chart in its thread colours. |
| B&W | 2 | The chart in black and white, as it prints. |
| Stitched | 3 | A picture of what the finished stitching will look like. |
Symbols (Y) shows or hides each thread's symbol on its stitches. Symbols are not drawn when the stitches are very small on screen.
Textures draws Colour and B&W with the chart's stitch texture, on its canvas texture, as Stitched draws them, and you can still draw on the chart. In B&W the texture is grey. With the photo under the chart, the photo shows instead of the cloth. Stitched always has its textures, so the switch is greyed out there.
Stitched is for looking only: to draw, switch back to Colour or B&W. It draws each stitch as thread on cloth, so it shows no symbols and no photo.
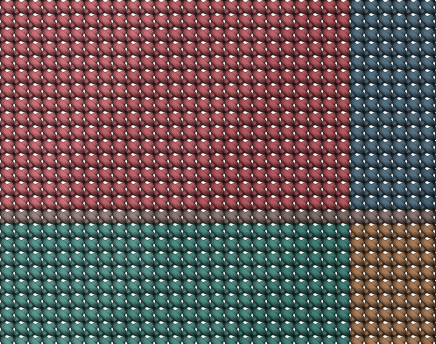
Textures
How Stitched draws the thread and the cloth, and Colour and B&W with Textures on, belongs to the chart: it is set in the Chart tab, the cogwheel, of the Edit workspace, saved with the chart, and each change is one step to undo.
- Stitch texture: how each stitch is drawn. Classic to begin with. Each choice shows a few stitches in your chart's own colours.
- Canvas texture: the cloth behind the stitches. Off (plain cloth in the canvas colour, to begin with), Natural linen or Counted canvas.
- Canvas colour: the colour of the cloth.
| Texture | What it is |
|---|---|
| Classic | How each stitch is drawn |
| Pixel | How each stitch is drawn |
| Cell outline | How each stitch is drawn |
| Cell outline shaded | How each stitch is drawn |
| Cross 2 | How each stitch is drawn |
| Natural linen | The cloth behind the stitches |
| Counted canvas | The cloth behind the stitches |
The stitch texture you choose is also used for the stitched picture you can export.
A new chart starts with the look set in Preferences, under A new chart's look. Changing it there leaves the charts you already have as they are. A chart saved before this setting existed shows the look in your Preferences until you choose one for it.
The photo under the chart
If the chart was made from a photo, Photo (P) shows that photo under the chart. A chart with no photo does not have these two controls. The Chart slider then fades the chart from fully shown (100%) to gone (0%, the photo alone), so you can check the chart against the photo.
Two keys go straight to the usual settings:
- 4 shows the photo with the chart half visible.
- 5 shows the photo alone.
While the chart is almost faded out (under 5%), it cannot be drawn on. Photo is greyed out for a chart started without a photo, and in Stitched.
Zooming and scrolling
- The mouse wheel scrolls the chart, and Shift with the wheel scrolls it sideways. Ctrl (Cmd on a Mac) with the wheel zooms about the point under the pointer, whatever tool you hold, and so does a pinch on a trackpad. To have the wheel zoom by itself, choose Zooms under The wheel in Preferences.
- + and − on the view bar zoom about the middle of the view (Ctrl+= and Ctrl+−). The percentage between them shows the zoom; press it to go back to 100% (Ctrl+1). Fit shows the whole chart (Ctrl+0).
- Zoom runs from 25% to 800%. It starts at 100% for each chart. At either end, + or − is greyed out.
- Pan (H): drag to scroll the chart. Holding Space with any tool in hand lets you drag to scroll, and lets go of the Pan when you let go of the key. You can drag from the empty space around the chart too, and take the chart anywhere on the screen, until only one stitch of it is left in view. Fit brings the whole chart back.
- Zoom (Z): click to zoom in, or choose Out in its options. Right-click, or hold Shift while you click, to zoom the other way.
On a touch screen
- One finger: a tap uses the tool and a drag moves the chart. A tap lays one stitch with the pen, and fills with Fill. Line, Rectangle, Oval, Select and Backstitch take one tap for each end. Lasso and Lasso fill take a tap for each corner and close on a double tap. Cancel, at the end of the tool's bar, drops what is not placed yet. The Move tool, and a piece or a line you have in hand, still move with your finger.
- Draw on drag, the pen at the bottom right of the chart, gives the drag to the tool, as with a mouse. Press it again to have the drag move the chart. A finger that starts off the chart always scrolls.
- Two fingers zoom by spreading or pinching, and scroll by moving together, whatever tool you hold. The chart grows or shrinks with your fingers and is drawn sharp again when you lift one. If a second finger lands while the first is drawing, that stroke is taken back.
- Anywhere but the chart, pinch to zoom the page itself, as on any other page.
- A pen always draws. The first time a pen draws, Draw with the pen only turns on: from then on a finger scrolls the chart and only the pen draws. Turn it off in Preferences, under Touch, and a finger uses the tools again; it stays off. On a phone a finger always uses the tools.
On a tablet or a phone every button is big enough for a fingertip, and the view controls are one row you slide sideways: over the foot of the chart, or on a phone held upright, just above the tool's settings. With Draw with the pen only on, the bar under the chart says that a finger moves the chart.
On a phone the tools are in one row along the foot of the screen; slide it sideways for more. The button at its end, named for the tab it opens on (Threads, Layers, Palette, Export…), opens the settings of Edit, Photo or Export over the chart; the cross at the top right closes them. Menu, at the top left, holds New chart, Open, Open recent, Save, Preferences, Help and your account. The view controls and the line of measurements under the chart slide sideways when they are wider than the screen.
On a phone these rows start folded away, and stay as you left them when the page reloads; press the strip at the foot of the screen to bring them up. To give the chart more room, swipe down over the tools or the grip above these rows, or press the arrow at the start of the tools' row. The tools, the tool's settings and the view controls under the chart fold away to the foot of the screen, leaving a strip with a grip and the line of measurements; the Photo, Edit and Export tabs at the top are hidden too. Swipe up on the strip, or press it, to bring them back. While something selected is in your hand they stay up, because what you do with it is there.
The settings sheet stops at three heights: drag its top edge up or down, or press the grip at its top to step to the next. Drag it right down, press the dimmed chart behind it, press the cross or go Back to close it. Turn the phone on its side and the tools stand down the left edge, and the chart keeps the height.
What is kept
The view you choose (Colour, B&W or Stitched, symbols, textures, photo and slider) is kept by this browser for the next time. A choice that does not apply in the current view, such as Photo in Stitched, waits and comes back when it applies. The zoom is not kept.
The grid is always drawn, with a heavier line every 10 stitches and a medium one every 5, and the rulers round the chart count every 10 stitches. Dashed blue lines cross at the chart's centre, with a blue arrow at each ruler, so you can find the middle to start stitching from. They are not drawn in Stitched, and not in what you export.